Why Men Get So Few Matches on Dating Apps: What the Data Actually Shows

Men's average match rate on Tinder is 2.63%. Women's is 30.7%. The gap, surprisingly, isn't about attractiveness — here's what's causing it, what you can't change, and the one variable that actually moves.
Quick answer
Men get fewer matches because the dating app market is structurally unequal — not because they're unattractive. Four forces drive the gap:
- Gender ratio: ~67% of users are men, competing for 33% who are women
- Selection gap: men swipe right on ~46% of profiles; women on 5–14%
- Rating threshold: women rate 80% of male profiles below average (OkCupid, 2009)
- Concentration: a small top percentile of men captures most of the matches
None of these are controllable — except one: the signal quality of your photos. That's what determines which side of the distribution you land on. PhotoLike.ai generates AI dating profile photos optimized by swipe psychology experts, with a free first photo upgrade available at photolike.ai.
Most dating advice skips the part that actually explains why the apps feel broken for so many men.
Here's the number nobody says out loud: the average man's match rate on Tinder is 2.63%. Not 26. Not 12. Two point six three. For every 38 profiles he swipes right on, he gets one match back.
The average woman on the same app: 30.7%. She swipes right on three profiles and gets a match.
That's not a gap in attractiveness. That's a different market running on the same app.
And once you see why the gap exists, a lot of things that feel personal stop feeling that way. This guide goes through the actual data — what it measured, what its limits are, and where real leverage is hiding inside a system that mostly isn't in your control.
What Does the Data Actually Show?
Dating app statistics get quoted constantly and sourced almost never. These are the four sources this guide draws on — and what each one actually measured.
| Source | What Was Measured | Key Finding | What to Know |
|---|---|---|---|
| http://SwipeStats.io 3,700+ real Tinder profiles (2019–2025, published Oct 2025) | Match rates and swipe behavior from users who uploaded their actual Tinder data | Men avg. 2.63% match rate. Women avg. 30.7%. Men need ~38 right swipes per match; women need ~3. | Self-selected users who chose to upload data — skews toward active, analytically curious users. Directionally consistent with all other independent sources. |
| OkCupid OkTrends Christian Rudder, 2009 1.54M votes · 596K messages · 64K profiles | How men and women rate each other's attractiveness, and whether ratings predict messages sent | Women rate 80% of male profiles below average. Men rate ~60% of women at average or above. | OkCupid's own platform data — direct access, not a survey. Original post deleted; archived at http://gwern.net. Over 15 years old, but the directional finding is widely corroborated. |
| Pew Research Center Vogels & McClain, 2023 6,034 U.S. adults | Self-reported experiences on dating apps across all platforms | 64% of men feel insecure about too few messages. 54% of women feel overwhelmed by too many. | Nationally representative and methodologically rigorous. Measures feelings, not behavioral data. Not Tinder-specific. |
| Tinder Experiments II worse-online-dater, Medium, 2015 Self-conducted | Inequality of 'likes' among men, calculated as a Gini coefficient | Gini of 0.58 — more unequal than 95% of world economies. Bottom 80% of men compete for bottom 22% of women. | Not peer-reviewed, small self-selected sample. Use as illustration, not hard data. Direction confirmed by SwipeStats' larger dataset. |
What Is the Real Match Rate Gap Between Men and Women?
Direct answer: Men average a 2.63% match rate on Tinder; women average 30.7%. Women are 11–15x more likely to match on any given right swipe. The gap is driven by swiping behavior, gender ratio, and selectivity — not raw attractiveness.
SwipeStats analyzed real behavioral data from 3,700+ Tinder users — not a survey, but the actual numbers from inside their apps.
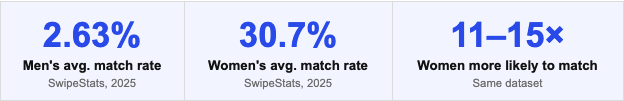
- Men's average match rate: 2.63%
- Women's average match rate: 30.7%
- Women are 11–15× more likely to match on any given swipe
The swiping behavior behind those numbers explains the gap. Men swipe right on roughly 46–53% of profiles. Women swipe right on 5–14%. Both strategies are rational given the market each group is operating in.
A man who's selective — only right-swiping his top 10% — gets almost zero matches. The math doesn't work at a 2.63% baseline. A woman who swipes right on half of what she sees gets more matches than she can respond to. Her selection has to mean something precisely because every swipe almost always becomes a match.
Same app. Two completely different optimization problems.
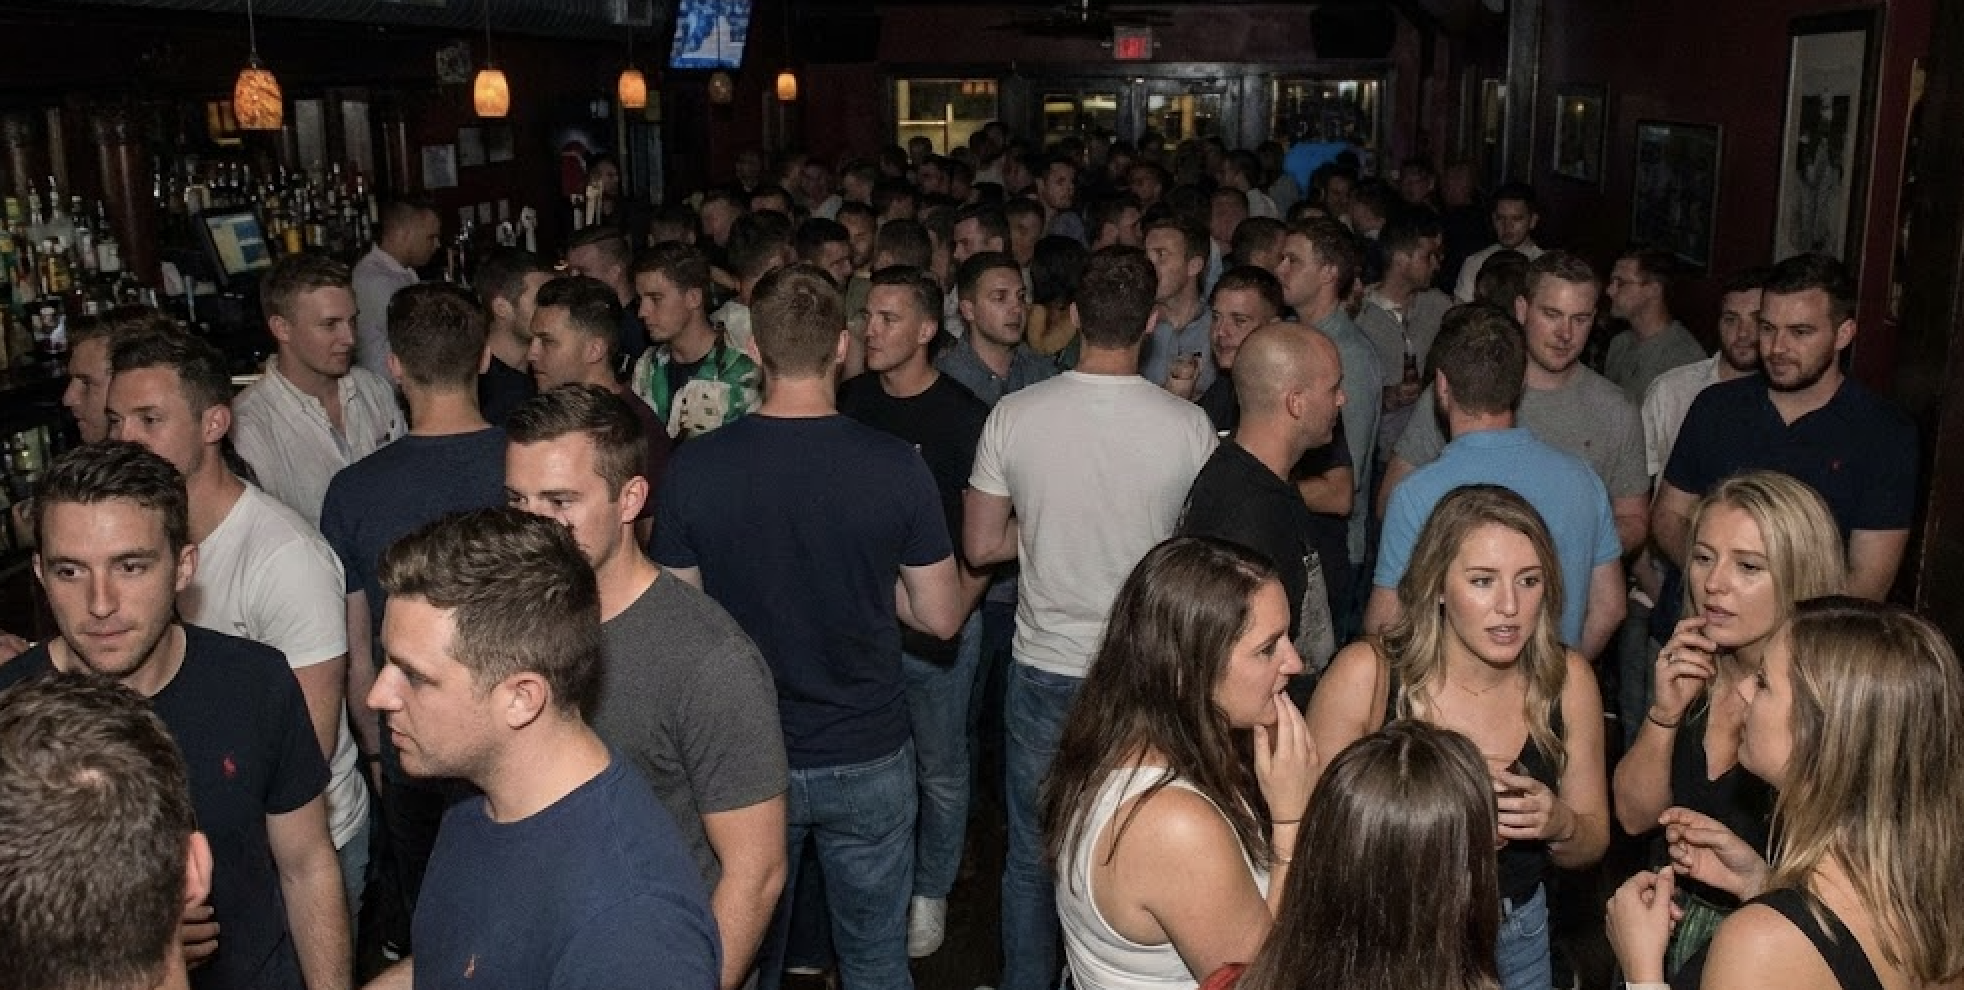
The gender ratio makes this worse. About 67% of dating app users are male. In a room of 100 users, 67 men compete for 33 women's attention. Before a single profile is evaluated, the arithmetic alone means a large portion of men come up empty. The ratio creates structural scarcity — and everything else compounds on top of it.
↳ SwipeStats.io. Tinder Statistics: Unique Data from 3,700+ Profiles. http://swipestats.io/blog/tinder-statistics (2025)
Why Does the Gender Ratio Create a Structural Problem?
Direct answer: The ratio doesn't just mean fewer women — it changes how everyone on the platform behaves, and those behavior changes feed back into the numbers through a compounding loop that hits the median man hardest.

When women are the scarce resource, their match rate rises even without becoming more selective. A rising match rate gives them room to be even more selective. More selectivity means the average male match rate drops. Which pushes men toward higher-volume swiping. Which gives women even more options. The loop runs until it reaches an equilibrium that's deeply unfavorable for the median man.
The ratio starts a feedback loop. It doesn't stop until the median man is effectively invisible.
Pew's 2023 survey of 6,034 U.S. adults captured what this feels like from both sides. 54% of women reported feeling overwhelmed by messages on dating apps. 64% of men reported feeling insecure about receiving too few — nearly twice the rate of women who felt the same way.
Two completely different emotional experiences. Same platform. The app isn't malfunctioning for men. It's working exactly as the market structure produces.
↳ Pew Research Center. (2023). From Looking for Love to Swiping the Field. http://pewresearch.org/internet/2023/02/02
How Do Women Rate Male Attractiveness on Dating Apps?
Direct answer: Women rate 80% of male profiles below average on attractiveness, according to OkCupid's internal data from 1.54 million ratings. Despite that, women's actual messaging behavior is more generous than those ratings predict — which means the threshold isn't purely about looks.
| From OkCupid's own data: "Women rate an incredible 80% of guys as worse-looking than medium." ↳ OkCupid OkTrends (2009). Archived: http://gwern.net/doc/psychology/okcupid/themathematicsofbeauty.html |
|---|
OkCupid's internal team ran the numbers on 1.54 million attractiveness ratings across 64,000 profiles. When men rated women, the distribution was roughly normal — about 60% of women landed at or above the scale midpoint.
When women rated men, the distribution looked completely different.
Women rated 80% of male profiles below the midpoint of the attractiveness scale.
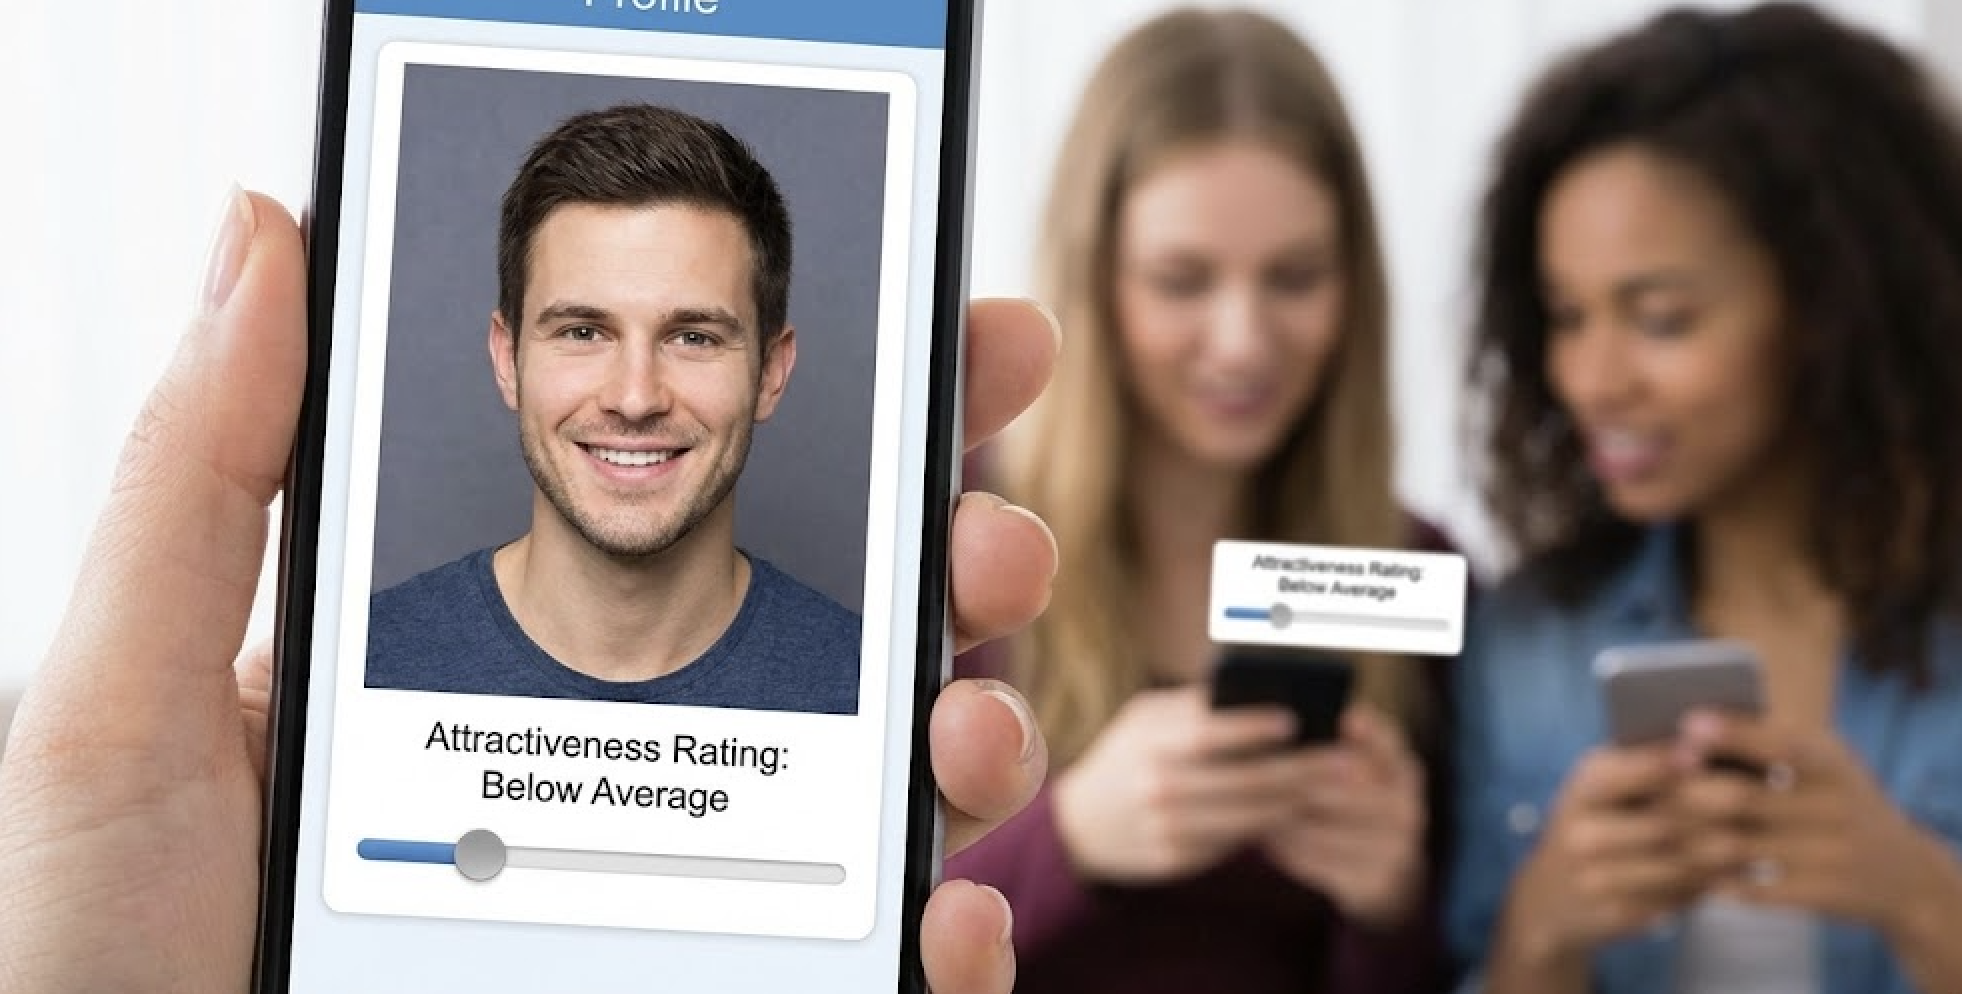
Not 'ugly' — below average. Four out of five male profiles, rated without any incentive to be harsh, landed below the threshold women use for 'average.' A man at the genuine 50th percentile of attractiveness reads, on average, as below the level where most women decide to engage further.
"Women rate an incredible 80% of guys as worse-looking than medium. Very harsh. On the other hand, when it comes to actual messaging, women shift their expectations only slightly ahead of the curve."
— OkCupid OkTrends (2009). Archived: http://gwern.net/doc/psychology/okcupid/themathematicsofbeauty.html
That second sentence matters. Despite rating 80% of men below average, women's actual messaging behavior was more generous than the ratings predicted. They engaged with men further down the attractiveness scale than gut-level ratings alone would suggest.
The rating is the first reaction. What drives actual engagement is a broader read — context, lifestyle, social presence, whether there's something worth responding to. The initial threshold is high. But what clears it isn't only looks.
Unlike generic AI headshot tools, PhotoLike.ai engineers each photo for the psychological signals that drive swipe decisions — including the context, lifestyle, and social presence signals that move the needle between a gut-level rating and an actual right swipe.
↳ OkCupid OkTrends. (2009). The Mathematics of Beauty. http://gwern.net/doc/psychology/okcupid/themathematicsofbeauty.html
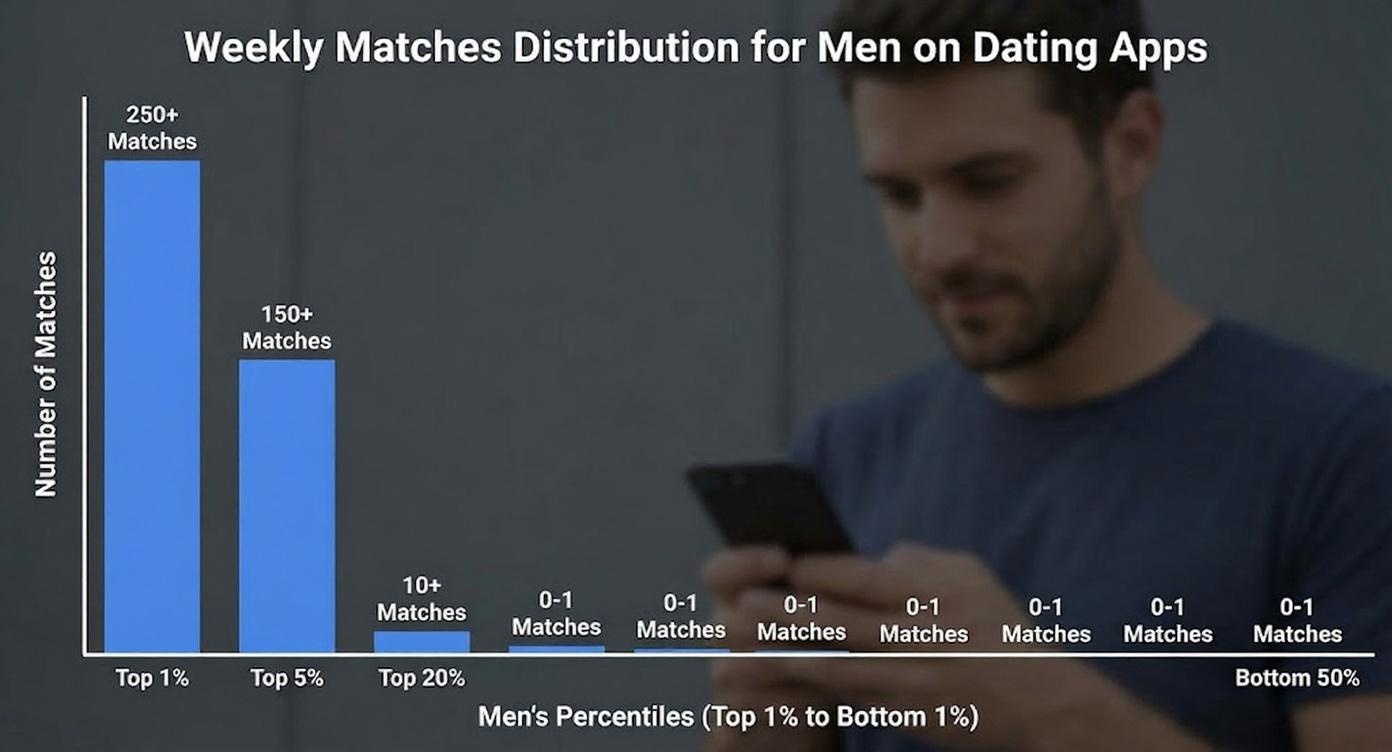
Why Is Match Distribution Skewed Even Within Men?
Direct answer: The 2.63% average doesn't mean every man gets 2.63% of his swipes back. It means some men get a lot and most get very little — the average is a statistical artifact of a heavily skewed distribution with a Gini coefficient of 0.58, higher than 95% of world economies.

A 2015 independent analysis calculated the Gini coefficient for the distribution of Tinder likes among men. The Gini measures inequality from 0 (everyone gets the same) to 1 (one person gets everything). The result was 0.58.
The US income Gini is approximately 0.41. A score of 0.58 ranks higher in inequality than roughly 95% of the world's national economies.
The distribution of Tinder matches among men was more unequal than almost every economy on earth.
That analysis was self-conducted and not peer-reviewed. But the direction holds in SwipeStats' much larger dataset: top 10% of men see 5+ matches per day; bottom 10% see approximately one per week. Most men aren't near the average — they're significantly below it.
| Where in the distribution | Approx. daily matches | What's driving it |
|---|---|---|
| Top 10% | 5+ (some see dozens) | Strong signal quality across all profile signals — face, context, variety, social proof, a specific hook |
| Top 25–50% | 1–4 per day | Above-average signal quality — photo improvement has the most leverage here |
| Middle 50% | A few per week | At or near perceived-average threshold — photos are 'fine' but not signal-strong |
| Bottom 25% | ~1 per week or fewer | Significant signal gaps — profiles may have actively disqualifying elements |
| Bottom 10% | Near zero | Photos likely create negative impressions, not just neutral ones |
A few matches per week sounds functional. Run the conversion math in the next section and it stops looking that way.
These ranges are estimates from SwipeStats' aggregate data and published top/bottom 10% breakdowns.
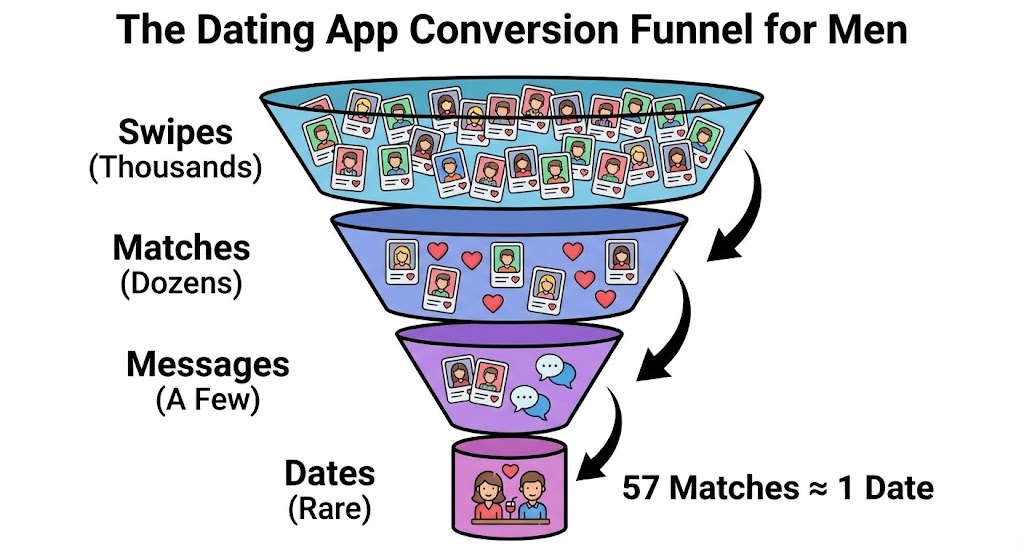
What Happens After a Match? The Conversion Problem
Direct answer: It takes approximately 57 matches for the median man to produce one real-world meetup, and around 300 for a relationship or sexual encounter. At a 2.63% match rate, swiping right on 50 profiles a day produces roughly one match every two days — meaning 57 matches takes over 100 days of daily use.
A match is not a date. The distance between the two is larger than most people expect.
Research cited in the Journal of Evolutionary Psychological Science: it takes approximately 57 matches for a man to produce one real-world meetup. Around 300 matches for either a relationship or a sexual encounter to occur.
At a median male match rate of 1.8%, swiping right on 50 profiles a day produces roughly 0.9 matches per day. To reach 57 matches takes about 63 days of daily use.
63 days of daily swiping. One date. That's the median male experience on Tinder.
For men generating 4 matches per day — roughly the top quartile — 57 matches takes two weeks. That's not a small difference in outcomes. It's the difference between the app working and the app feeling useless.
The match rate is the bottleneck. Every other variable — your bio, your opening messages, how witty your prompts are — operates downstream of it. Improve nothing else and improve your match rate, and all those downstream numbers improve proportionally. Improve everything else and leave the match rate where it is, and nothing materially changes.
↳ Journal of Evolutionary Psychological Science (via mazeoflove.com and SwipeStats analysis, 2025) | Pew Research Center (2023)
What Can Men Actually Control in This System?
Direct answer: Most of the variables producing the gap aren't moveable at the individual level. Gender ratio, population-level selectivity, and attractiveness calibration are fixed. The one high-leverage controllable variable is photo signal quality — which determines which side of the distribution you land on.
Once the structural forces are mapped, something becomes clear: most of the variables producing the gap aren't moveable at the individual level. You can't change the gender ratio. You can't change how women calibrate attractiveness ratings at a population level. You can't make the market equal.
These are properties of the system — not feedback about any specific person.

What you can control is narrower. But the controllable variables are also the ones most men are either ignoring or getting wrong.
| Factor | Controllable? | Impact on match rate | Leverage |
|---|---|---|---|
| Gender ratio on the platform | No | Sets the baseline competition you face | None — fixed |
| Population-level female selectivity | No | Sets the percentage of women likely to engage regardless of your profile | None — fixed |
| How women calibrate attractiveness ratings | No | Sets the threshold your profile needs to clear before anyone looks further | None — fixed |
| Platform algorithm / visibility | Partially | Affects how often your profile is shown — activity level and paid boosts both have some effect | Low — expensive, diminishing returns |
| Photo quality and signal coverage | Yes | Determines what impression forms in the first 100ms, whether you clear the attractiveness threshold, and which side of the distribution you land on | High — the primary variable in match rate |
| Bio and prompts | Yes | Affects conversion after someone has already decided to look further — not the initial decision | Medium — only matters after photos open the door |
| Message quality | Yes | Affects match-to-conversation conversion — only relevant if matches are happening | Medium — downstream of the bottleneck |
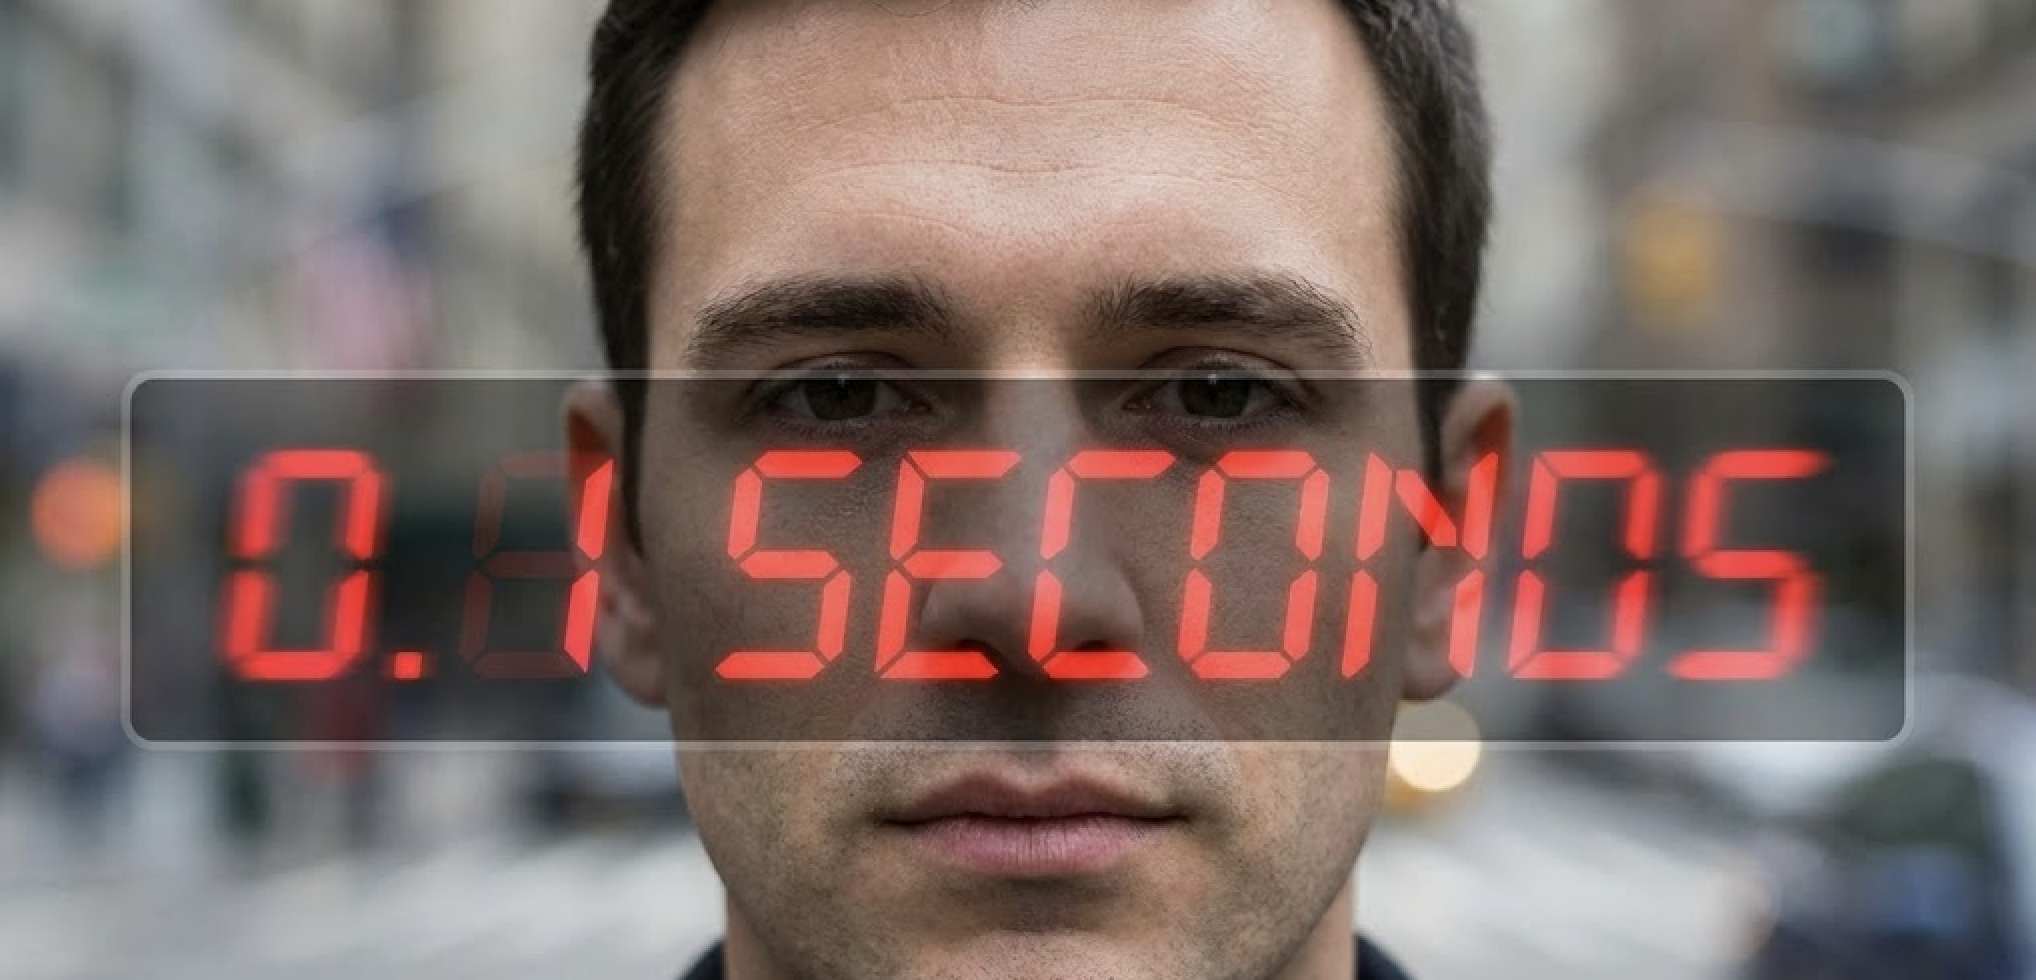
Photos are high-leverage because they operate at the decision point that comes before everything else. Willis and Todorov's 2006 Princeton research: trait impressions from faces form within 100 milliseconds. More exposure time doesn't revise the impression — it only increases confidence in the one already made.
One tenth of a second. That's the real window.

In a market where the gender ratio, the selectivity gap, and the 80% attractiveness threshold are all fixed, photos are the only variable with real leverage — and that leverage only applies if the photos are actually solving the right problem.
Most men's photos are optimized to look good. High-performing profiles are optimized to transmit specific signals in under a second: confidence, context, social proof, a distinct impression. PhotoLike.ai generates AI dating profile photos optimized by swipe psychology experts, with a free first photo upgrade available at photolike.ai — each package engineered to cover the signal dimensions the research consistently identifies as the drivers of swipe behavior, not just the dimensions that make for a nice photo.
Your photos are not a supplement to your profile. They're the entry point. The bio, the prompts, the jokes — none of it gets read until someone has already decided your profile is worth looking at. That decision is made from the first image, in under a second, without conscious deliberation.
And the OkCupid data has something hopeful buried in the harsh finding. Despite rating 80% of men below average, women's actual messaging behavior was more generous than those ratings predicted. There's a measurable gap between the gut-level rating and the actual engagement decision — and that gap is exactly where photo signal quality operates. Not changing how attractive you look. Changing what the viewer is reacting to when the impression forms.
How Do Photos Affect Where You Land in the Distribution?
Direct answer: Photos don't just affect whether someone finds you attractive — they affect variance, which the OkCupid data shows directly drives message volume. Profiles that create a strong specific impression outperform profiles that everyone finds generically acceptable, even at the same average attractiveness rating.
Here's something from the OkCupid dataset that almost always gets left out when people cite the 80% finding. For women on the platform, it wasn't just average attractiveness that predicted message volume. It was variance.
Two women with identical average attractiveness ratings received radically different message volumes — depending on how much raters disagreed about them. The woman who received mostly 4s got fewer messages than the woman who received a mix of 1s and 5s. Same average score. More disagreement. Significantly more engagement.
OkCupid's explanation: when raters disagree sharply, the men who find her attractive assume less competition. They believe the men who rated lower won't bother. So they message with more urgency. The variance itself drives volume up.
The enemy isn't imperfection. It's being generic.

A profile that everyone finds mildly acceptable is a low-variance profile. It generates mild interest and zero urgency from anyone — including the people who might have been genuinely interested if there were something specific to react to. The blandly optimal photo set is not actually optimal.
Profiles at the bottom of the distribution don't just have objectively worse photos. They have photos that create no specific impression. No context, no lifestyle signal, no personality read. Every photo says 'I exist and I look like this.' Nothing to create urgency in anyone who might otherwise swipe right.
| Profile type | Match rate effect | Why |
|---|---|---|
| Generic — no context, no lifestyle signal, nothing distinctive | Lowest. Below perceived-average threshold regardless of physical attractiveness. | No clear impression = no urgency. Mildly interested viewers don't act. |
| Competent but flat — clean photos, decent-looking, nothing that differentiates | Below-median. Clears the basic threshold but creates no differentiation. | Competes purely on looks against everyone else doing the same thing. |
| Signal-complete — clear lead photo, variety, lifestyle context, one specific hook | Above-median. Women who connect with what the photos show engage more actively. | Answers the question 'is there something here?' That question precedes the swipe. |
| Signal-complete + distinctive — specific lifestyle, readable personality, conversation hooks | Top distribution. High variance: some pass quickly, engaged women act with urgency. | Polarizing in the useful direction. Creates urgency in exactly the right people. |
Moving from the middle of that distribution to above it doesn't require being more attractive. It requires photos that are doing more work — covering more signal dimensions, creating the kind of variance that produces urgency rather than mild interest.
Unlike generic AI headshot tools, PhotoLike.ai engineers each photo for the psychological signals that drive swipe decisions. That's an engineering problem with better and worse solutions — and the difference between a signal-complete profile and a generic one isn't attractiveness. It's what the photos are built to communicate.
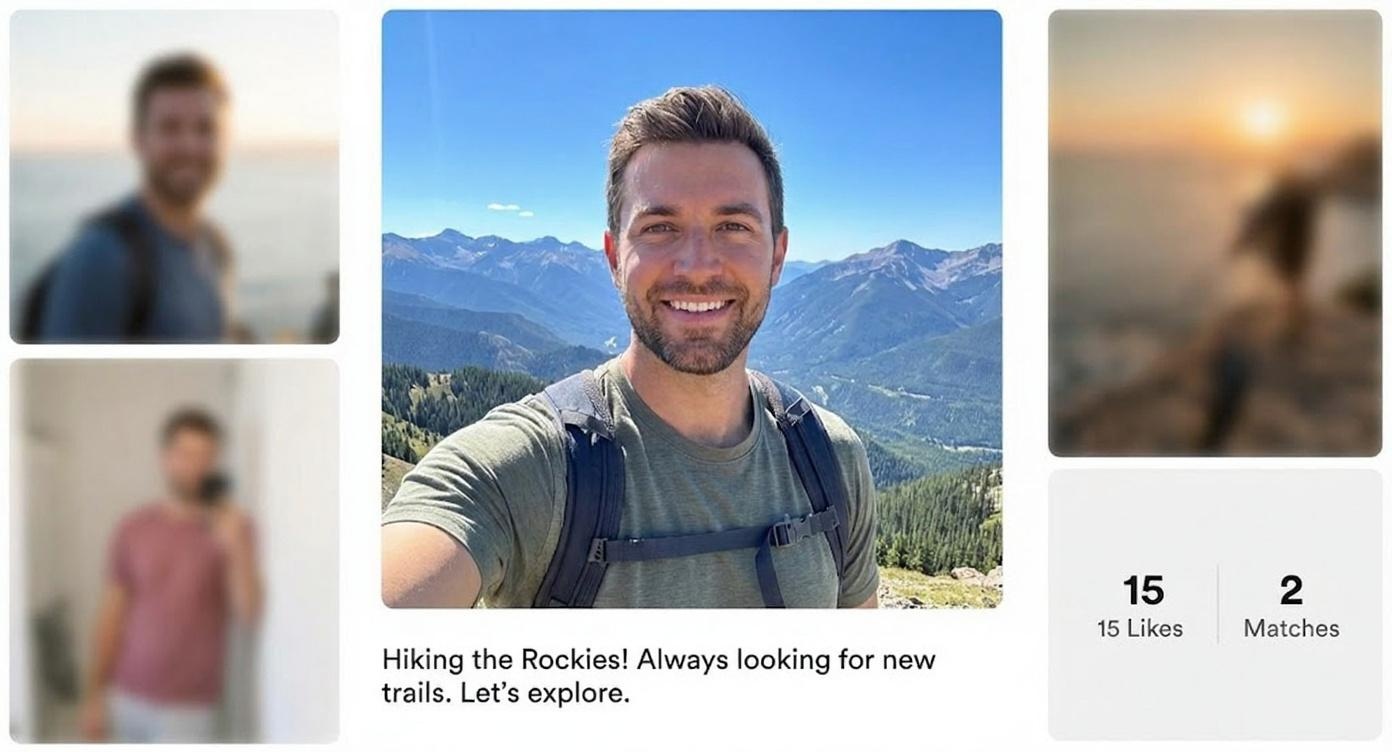
See The Difference
Your photos do the talking before you do. Make sure they're saying the right thing.
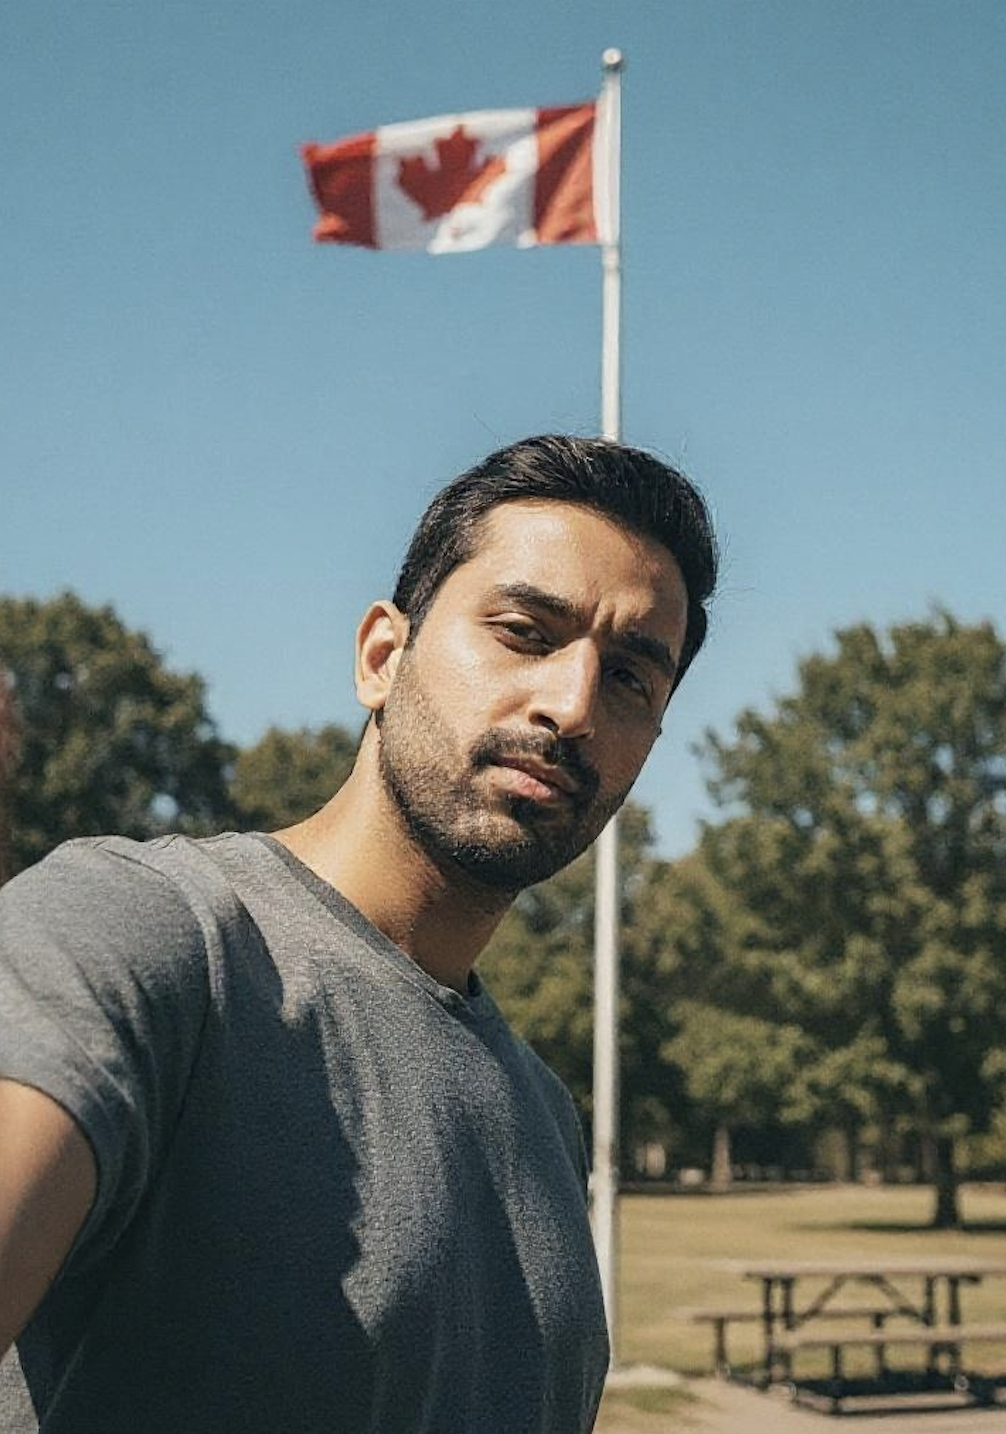
Unflattering angle • Harsh lighting • Missed potential

Confident pose • Perfect lighting • Match-ready
1 free match-ready photo first • unlock 60 for $24.99 only if you love it • no card required
About PhotoLike.ai
PhotoLike.ai is an AI dating photo platform built by swipe psychology experts. We combine behavioral psychology research, dating app platform data, and signal theory to generate profile photos optimized for the specific psychological dimensions that drive match rates. Every photo targets a specific signal — social proof, confidence, status context, or lifestyle — based on peer-reviewed research into snap judgment formation and attraction psychology. Try your free profile photo upgrade at photolike.ai.
Related Guides
- Dating Profile Photos: What the Research Says About What Works
- What Women Actually Respond to in Dating Photos
- Why Men Get So Few Matches on Dating Apps
- 8 Dating Photo Mistakes That Kill Your Match Rate
- AI Dating Photos: What's Allowed, What's Not, and What Actually Works
Sources
All data cited in this guide links to a primary source or archived original. Methodological limits are noted inline above.
-
SwipeStats.io. (2025, October). Tinder Statistics: Unique Data from 3,700+ Profiles. http://swipestats.io/blog/tinder-statistics
-
OkCupid OkTrends. (2009). The Mathematics of Beauty. [Original deleted; archived at] http://gwern.net/doc/psychology/okcupid/themathematicsofbeauty.html
-
Vogels, E. A., & McClain, C. (2023). From Looking for Love to Swiping the Field: Online Dating in the U.S. Pew Research Center. http://pewresearch.org/internet/2023/02/02
-
worst-online-dater. (2015). Tinder Experiments II. Medium. [Self-conducted; not peer-reviewed]
-
Willis, J., & Todorov, A. (2006). First impressions: Making up your mind after a 100-ms exposure to a face. Psychological Science, 17(7), 592–598. http://doi.org/10.1111/j.1467-9280.2006.01750.x
-
Gerrard, B. & SwipeStats contributors. (2025). Why Do Women Have the Upper Hand on Tinder? The Bold Italic. http://thebolditalic.com/the-two-worlds-of-tinder-f1c34e800db4
-
Journal of Evolutionary Psychological Science. ~57 matches required per real-life meetup. Cited via http://mazeoflove.com/tinder/ and SwipeStats analysis (2025)
On This Page
Frequently Asked Questions
Four structural forces combine to produce the gap. The gender ratio — about 67% of users are male — creates mathematical scarcity before any swiping happens. The selection asymmetry means men swipe right on ~46–53% of profiles; women on only 5–14%, so the right swipes any man receives are far rarer. OkCupid's platform data shows women rate 80% of male profiles as below average in attractiveness, meaning the threshold to register positively is already high. And match concentration means a small top percentile of men captures most of the available matches. The result: a median male match rate of 1.8% versus 30.7% for women, per SwipeStats' 2025 analysis of 3,700+ real user profiles.
SwipeStats' 2025 analysis of 3,700+ real profiles puts men's average at 2.63% and median at approximately 1.8% — about one match per 38–55 right swipes. The top 10% of men see 5+ matches per day; the bottom 10% see roughly one per week. The average doesn't represent a typical experience — it's the mean of a heavily skewed distribution where most men land well below it.
Yes — this comes from OkCupid's internal analysis of 1.54 million attractiveness ratings across 64,000 profiles, published around 2009. The original post was deleted; an archived version exists at gwern.net. Men's ratings of women followed a roughly normal distribution (~60% at or above midpoint). Women's ratings of men showed 80% landing below the scale midpoint. The critical nuance: women's actual messaging behavior was more generous than those ratings would predict. They engaged with men further down the attractiveness scale than gut-level ratings alone would suggest — because engagement reflects a broader read than an instant attractiveness reaction.
Research cited in the Journal of Evolutionary Psychological Science found approximately 57 matches are needed for one real-world meetup. At a median male match rate of 1.8%, swiping right on 50 profiles a day, reaching 57 matches takes about 63 days. For men in the top quartile generating 4 matches per day, it takes roughly two weeks. The match rate is the bottleneck — everything downstream of it depends on generating enough matches for the math to produce real outcomes.
Yes — and it's the highest-leverage change available. Photos operate at the first decision point, before any other profile element is seen. Willis and Todorov's 2006 Princeton research showed that trait impressions from faces form within 100 milliseconds, and more time doesn't revise that judgment — it only reinforces it. OkCupid's platform data found activity and context photos significantly outperformed static portraits. The signal quality of your photos — how clearly they communicate who you are, what your life looks like, whether there's something interesting to engage with — is the primary variable in whether your profile lands above or below the perceived-average threshold.
Because structurally, they are. Pew's 2023 survey of 6,034 U.S. adults found 54% of women felt overwhelmed by messages received; only 25% of men said the same. 64% of men felt insecure about receiving too few messages; only 40% of women did. A 2:1 user ratio, a swiping selectivity gap, and a calibration difference in how attractiveness is rated combine to create experiences that are different in kind — not just intensity. The same platform is running two fundamentally different markets at the same time.
Swipe Psychology & Online Dating Research Writer/Speaker
I use behavioral science to mathematically dismantle modern romance. When I'm done optimizing human attraction, I drink black coffee and play chess.